Cloud.
But closer.
Get virtual machines, containers, and cloud services that are closer than ever to your data sources and destinations. Faster I/O. Higher distro. Because every millisecond matters at the edge.
New customers get a $500 credit. Learn more
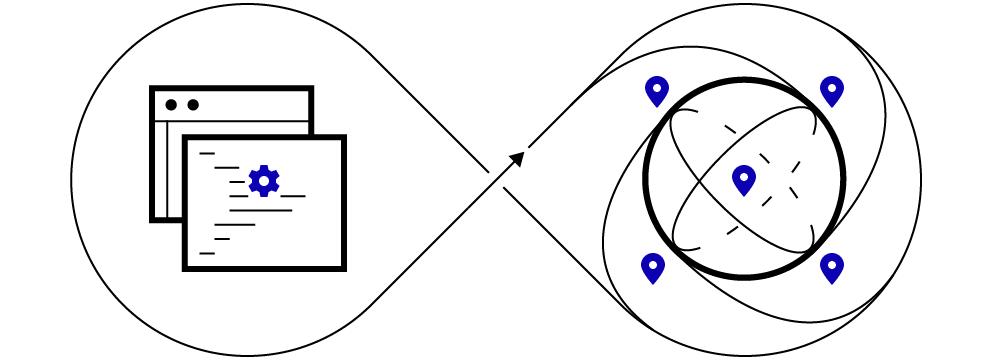
StackPath is a cloud computing platform right in the city limits of major markets around the world, rather than a handful of zones that actually sit somewhere out of town.
That way, your internet-centric applications and microservices can run in more places, much closer to users and devices.
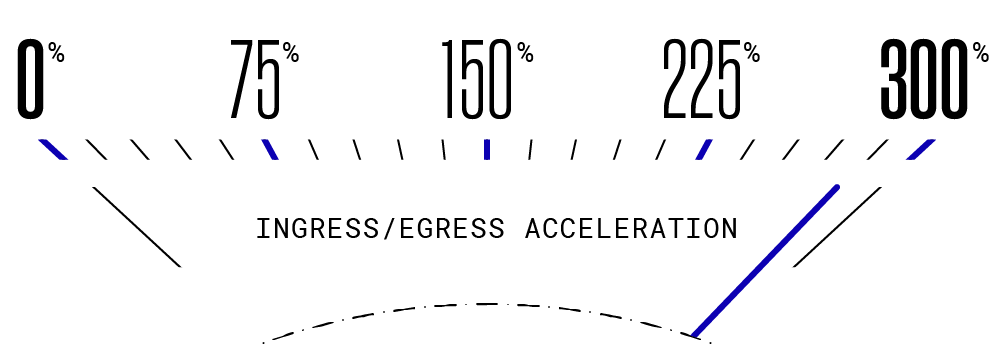
Speed
Data can reach our VMs and containers up to 300% faster than hyperscale cloud instances.
Scalability
Workloads can leverage our wide range of instance sizes and capacity in edge locations around the world to scale up, down, in, and out on demand. And smart.
Markets
38
EDGE Locations
44
Egress Capacity
75+Tbps
Cost and solution control
Our edge-aware, API-first, friction-free approach to platform and product design gives you direct control over solutions, costs, and outcomes. Our edge is yours.
SP// News & Updates

Ready to build
your edge?
Sign up and set up StackPath today or request a demo.
New customers get a $500 credit. Learn more